Three-phase flow example
Overview
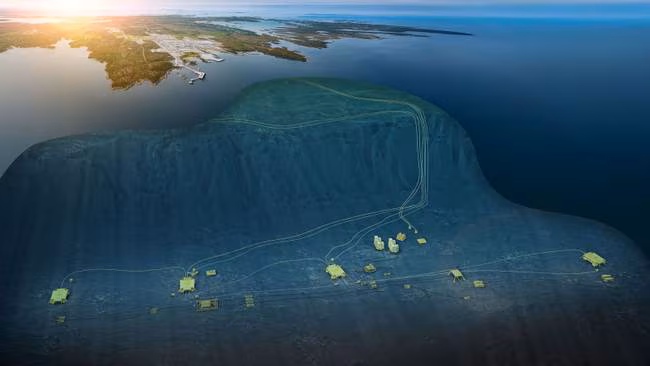
This example provides realistic data for simulating a flowline at the groundbreaking Ormen Lange field, ready to be simulated.
Located 120 km offshore in the southern Norwegian Sea, Ormen Lange was discovered in 1997 and began production in 2007. It is Norway’s second-largest gas field and its first deepwater development.
The produced "gas" is not dry—it contains condensate and water, making it a three-phase flow system.
- It contains mostly gas.
- In all or part of the line, pressures and temperatures are such that liquids also form.
- Hydrates may form and block the flow.
- The hydrate mitigation strategy are based on injecting extra liquid (MEG).
- Liquid injection may be the best mitigation option—but it is expensive, and it also tends to worsen potential slugging problems.
Subsea Infrastructure
At Ormen Lange, the subsea templates are installed at depths between 800 and 1,000 meters. Two identical 121 km flowlines transport the gas to the onshore processing and export facility on Norway’s west coast.
- During low production periods—such as startup or late-life operation—slugging risks tend to increase.
- In configurations like Ormen Lange, gas can be routed down one flowline and returned through the other, maintaining flow velocity and suppressing slugs.
- A looped system may also help remove hydrate plugs, offering a dual benefit for flow assurance and operational reliability.
In this example, the simulation is configured to model a single flowline at a time—a setup that users can easily adjust to include both lines if desired.
To prevent hydrate formation and line blockages, two additional lines supply MEG (Monoethylene Glycol). While MEG is effective at inhibiting hydrates, it also adds liquid to the flow, which increases slugging risk.
Development & Innovation
When the Norwegian Parliament approved the original field development in 2004, it wisely required planning for future technology upgrades, including both topside and subsea compression to extend field life and boost production.
- Topside pressure boosters were completed in 2017.
- The subsea compression system—the world’s deepest—became operational in June 2025.
This subsea compression system alone is expected to generate an additional $7 billion USD in revenue, highlighting the value of early-stage planning and future-proofing.
- Begin exploring flow assurance enhancements during the Pre-FEED or FEED phases.
- This proactive approach—encouraged by slug-limit curve analysis—can reduce long-term costs.
To be on the safe side, large and costly slug catchers were installed to manage potential severe slugging topside by the flowlines' outlets. Could slugging have been mitigated in other ways by using the looped flowlines and the extra compressors?
This example encourages users to explore such questions through slug-limit curve simulations, in combination with design modifications and various operational strategies.
Using the Example
The full Ormen Lange dataset includes boundary conditions, sea temperatures, fluid properties, actual line elevation profiles and design
and more, and can be found in the FlowlineProSS example list which appears when the Open-button is clicked.
- Start by simulating and studying plots based on the default configuration.
- Experiment with inlet flows, outlet pressures, and other boundary conditions.
- Optionally add a second flowline and connect it to the first, forming a ring-line configuration.
- This setup allows extra gas injection from topside, maintaining high flow rates to help prevent slugging.
The fluid
The fluid's composition can be studied by investigating the heading text in the PVT-file.
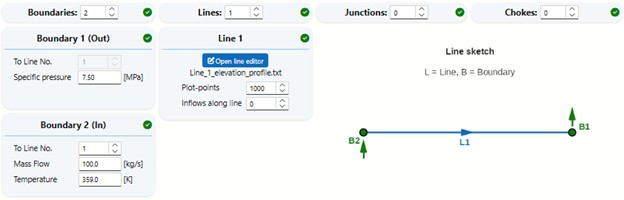
Defining the network
The network definition is quite straight forward:
The elevation profile
The Ormen Lange elevation profile may be quite familiar by now - it has been chosen as the main example throughout this user manual:
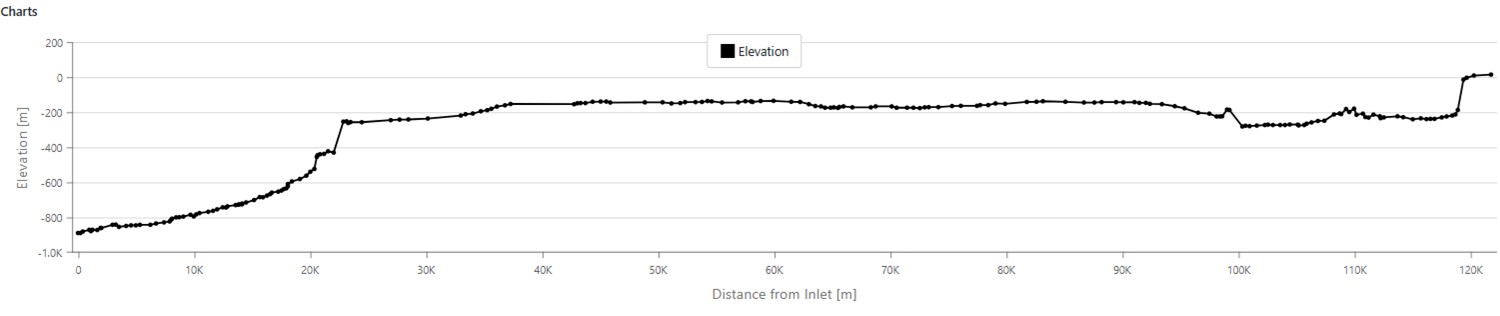
The inner diameter is 0.690 m, and it consists of 2 main layers.
Hydrate Mitigation
Is there a hydrate problem?
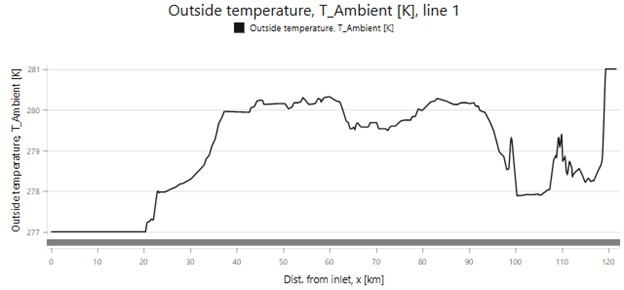
The Ormen Lange flowlines are surrounded by quite cold sea, and the relatively high pressure required to bring the fluid up to the surface is an unfavorable combination for avoiding hydrate formation.
The plot below shows a typical winter sea temperature along the lines. The inlet end at 277 K (4 °C) can even drop to 272 K (−1 °C) on some days.
If we simulate an Ormen Lange flowline with a typical well fluid, but do nothing to prevent hydrates from forming, the pressure and temperature plots, with hydrate curves, may look like this (for a given composition, at typical pressures):
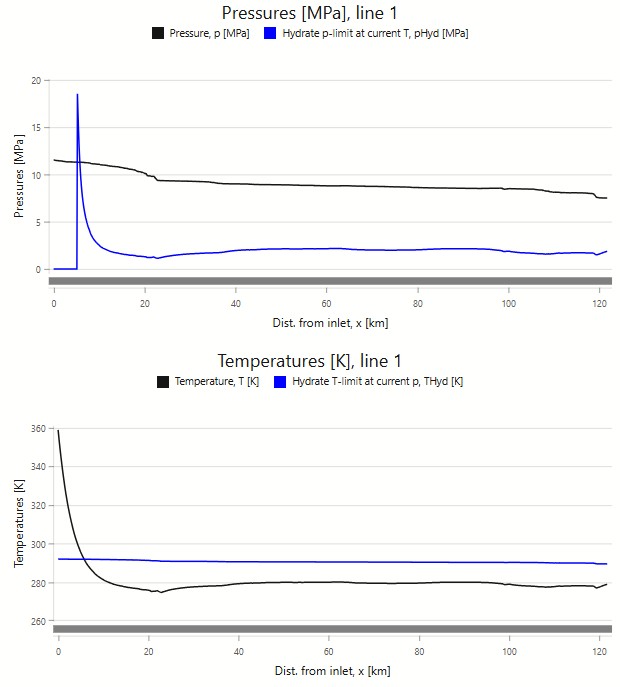
The black temperature plot shows that the fluid is quite hot when it enters the line, and it cools down gradually due to the cold surrounding sea and, to some extent, the Joule-Thompson effect from gas expansion.
The blue hydrate limit pressure curve is above the actual pressure near the inlet only.
(The first 5 kilometers are so hot that the corresponding hydrate pressure would have had to be higher than what the hydrate table covers,
so it is simply shown as zero in the plot.)
But around 6 km into the line, the hydrate pressure curve drops below the actual pressure—meaning hydrates would form.
The same can be seen in the temperature plots: at around 6 km into the line, the hydrate temperature curve is above the actual temperature, indicating that the fluid is not warm enough to avoid hydrate formation at those pressures.
These plots show that unless something is done, hydrates would form and block the line—most likely around 6 km from the inlet.
If an inlet choke were included in the simulation, it would show that it contributes to lower temperatures due to the Joule-Thompson effect, making the downstream side of the choke a likely hydrate problem location.
After a shutdown, the condition could become even worse: the whole line could cool down, and hydrates might form almost everywhere.
The Ormen Lange hydrate strategy
At Ormen Lange, the flowlines are too long for heating to be a practical solution. Instead, MEG injection at the flowline inlets was chosen.
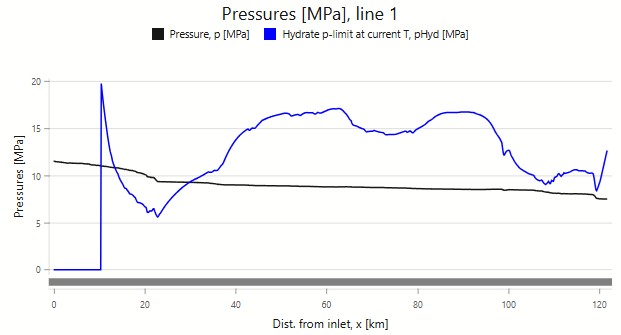
Injecting 0.1 mol-percent MEG lifts the hydrate curve above the pressure curve for most of the line—but not between 14 and 30 km from the inlet. This indicates that 0.1 mol-percent MEG is insufficient under these operational conditions. A higher injection rate, perhaps up to 0.2 mol-percent, may be required.
The next plots use the same fluid, but with an increased mass flow—from 100 kg/s to 250 kg/s.
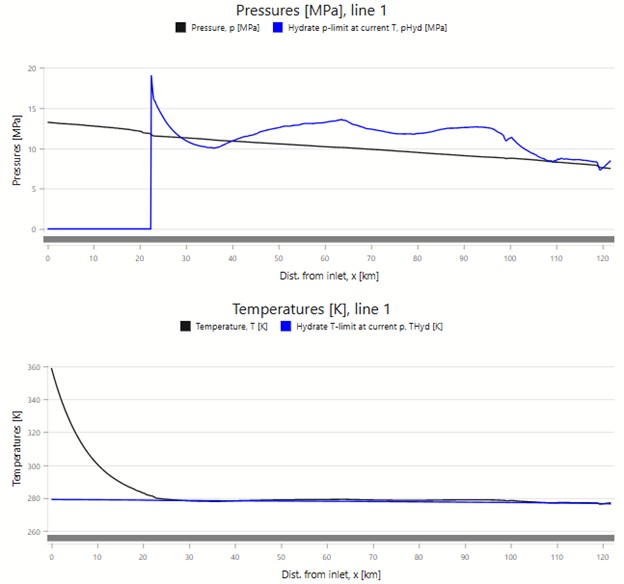
With faster flow, the fluid spends less time in the high-pressure region near the inlet and travels further before cooling toward sea temperature. This effect nearly prevents hydrate formation—but not entirely. Increased MEG injection would still be needed.
Further increasing the flow (not shown) would raise pressure losses and require a higher inlet pressure, potentially worsening hydrate conditions. This highlights the complexity of MEG injection strategy: it depends on mass flow, sea temperature, currents, and potential shutdown scenarios. Balancing MEG cost against hydrate risk requires extensive simulation across multiple scenarios.
Turn-down Curve
The turn-down curve shows that for the chosen outlet pressure of 7.5 MPa (see Network image), the turndown rate is approximately 131 kg/s. At that flow rate, the required inlet pressure would be around 11.1 MPa.
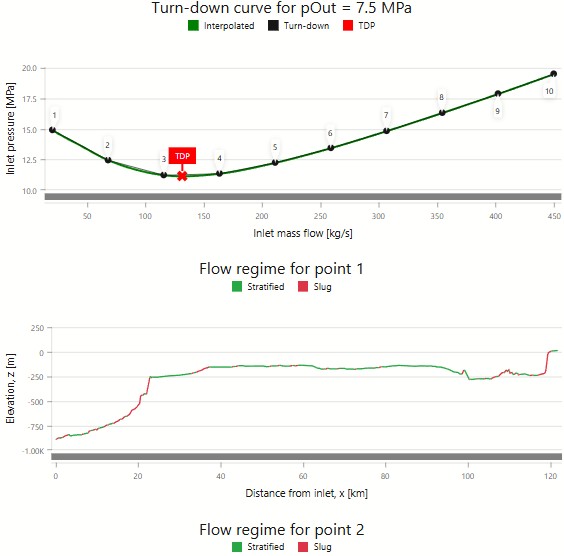
The flow regime plot for point 1 reveals that slugging is most likely in the steepest sections of the line—unfortunately near the outlet. Avoiding outlet slugs may require significantly higher flow rates. The exact threshold can be studied using the other 9 flow regime plots. Even better: use the slug-limit curve described below.
Slug-limit Curves
To generate the slug-limit curves, the following input parameters were chosen:
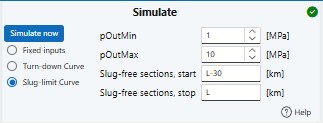
That produced the following curves:
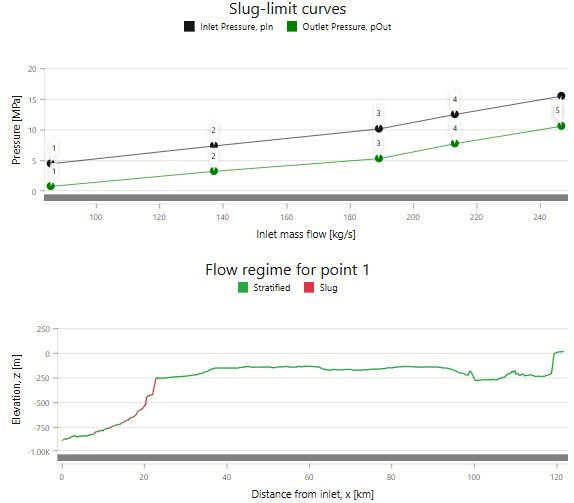
If we examine the point on the slug-limit curve where the outlet pressure is 7.5 MPa—matching the outlet pressure used for the turn-down curve—we find a corresponding mass flow of approximately 205 kg/s. This is significantly higher than the turn-down rate of 131 kg/s, showing that relying on the turndown rate as a guide for minimum flow would be misleading.
Reducing the outlet pressure—if necessary by installing a pressure booster at the outlet (as has now been done at Ormen Lange)—would allow slug-free outlet flow at a much lower flow rate than what is achievable with a 7.5 MPa outlet pressure. Lower outlet pressure also reduces the required inlet pressure.
While the large slug catchers at the flowline outlets make this less critical at Ormen Lange, this strategy could extend the lifespan of many other subsea fields.