Main Menu
General
FlowlineProSS is operated via the ribbon interface located at the top of the screen:
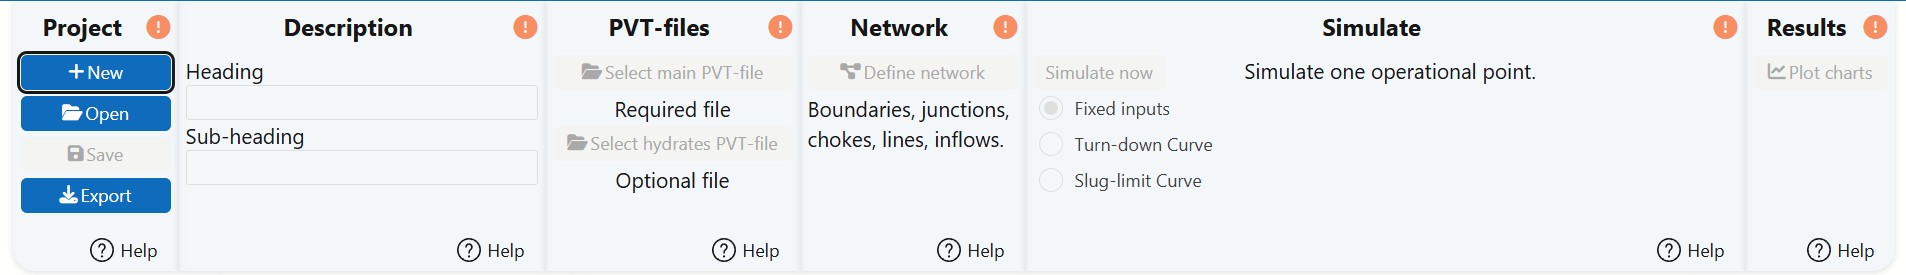
To begin a project, simply follow the ribbon menu from left to right.
As you enter the required data, the first four orange indicator icons will turn green, signaling that the corresponding input has been successfully provided.
Once all inputs pass FlowlineProSS’s built-in validation system, you can simulate. Afterward, results can be explored through a variety of interactive plot types.
For additional guidance, hover your cursor over any indicator icon or click the Help button within each section to access context-specific information.
Project
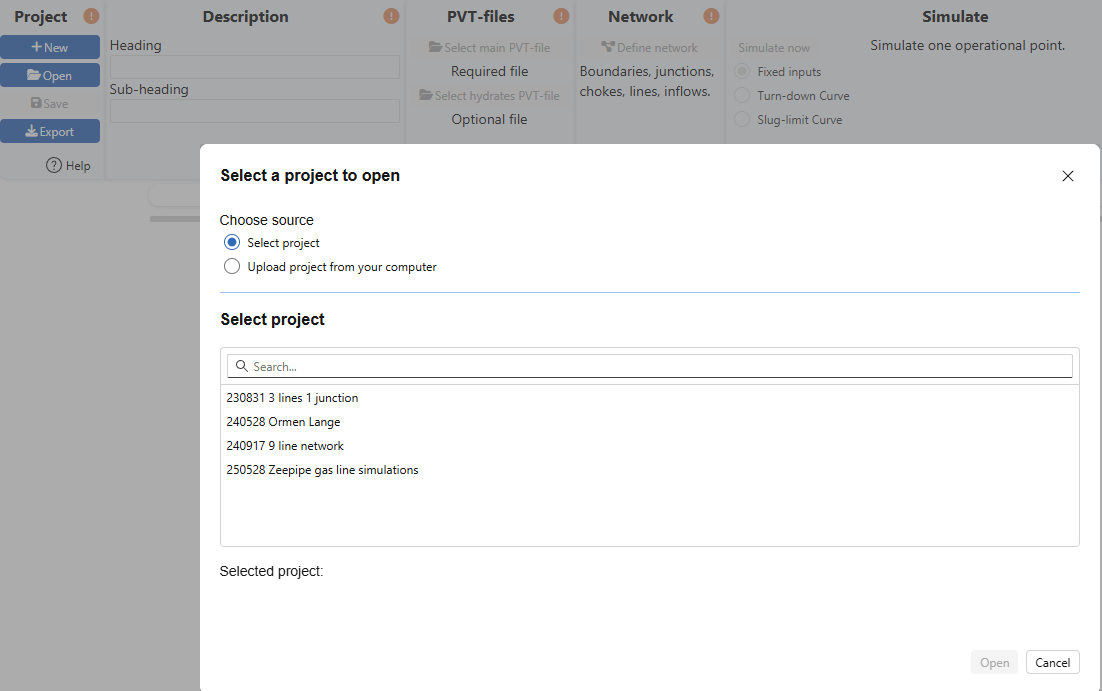
To get started, you can either create a new project or open an existing one. FlowlineProSS includes a variety of pre-defined examples that can be run as-is or customized to suit your needs.
Once you've created your own projects, they can be easily retrieved later using the Open button.
This flexible setup makes it easy to revisit previous work or explore ready-made simulations.
Description

The Description section helps clearly identify and organize your project.
It includes two fields:
- Heading – Required: Serves as the main project title
- Sub-heading – Optional: Adds context or reference details
Example
- Heading: Ormen Lange Flowline
- Sub-heading: Ref. A1, Minimum Flow
Providing a clear heading ensures your project is easy to locate and reference later.
PVT-files
During simulations, FlowlineProSS requires accurate fluid property data across the range of pressures and temperatures encountered. These properties are calculated by interpolating between tabulated values, provided in a PVT file.
If hydrate formation is to be considered, an additional hydrate file—containing relevant properties for the same fluid—must also be included.
File Setup
- Files can be copied from your local computer or from another project folder on the server.
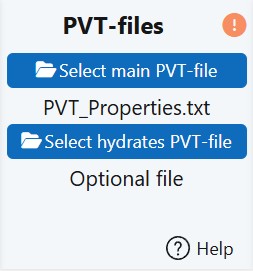
- Once copied, the main file will be named:
PVT_Properties.txt. - Once copied, the hydrate file will be named:
Hydrate_Properties.txt.
Once selected, FlowlineProSS automatically checks:
- That all required data is present and uncorrupted.
- That the pressure and temperature ranges in the file cover the values specified in the network boundaries.
Common Input Errors
In the example above, the main PVT file has been selected (PVT_Properties.txt), but the indicator remains orange.
Hovering over the icon reveals the issue:
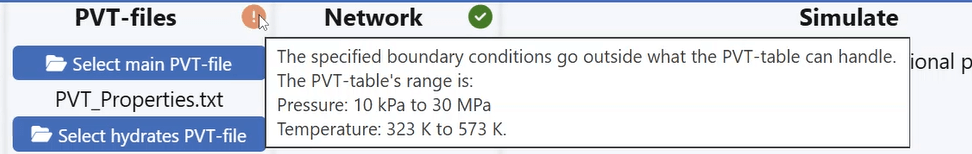
Here, the inlet boundary B2 (see the Networks section) was mistakenly set to 86, intended as 86 °C, but FlowlineProSS expects temperatures in Kelvin. Therefore, 86 K is interpreted as –189 °C, far below any realistic fluid property range, and outside what the PVT-table covers.

Correcting the temperature input to 359 K resolves the issue, and the PVT indicator turns green.
- All pressure and temperature inputs are specified in Mega-Pascal (MPa) and Kelvin (K).
- The PVT-table fully covers the pressure and temperature range defined by the network boundary conditions.
- As far as possible, the PVT-table also covers the expected operating range (with some margin due to variation during the iteration) that may be encountered during the simulation.
Creating PVT-files
FlowlineProSS integrates seamlessly with ESSS FASE PVT, which is included as part of your license. This tool allows you to generate fluid property tables tailored to your simulation needs.
Alternatively, you can:
- Request PVT files directly from the FlowlineProSS support team.
- Import files created using third-party software such as PVTsim, provided they follow the required format.
- Custom PVT Interface Support - if you prefer to use a different PVT program but lack a compatible interface, FlowlineProSS support can assist in developing a tailored solution to ensure seamless integration.
- If you plan to use PVT files from third-party sources and need formatting guidance, please contact FlowlineProSS Support for assistance.
Network

Clicking the Define Network button opens the network configuration menu, where you can specify all elements that make up your system:
- Flowlines
- Junctions
- Boundary conditions
- Other structural and operational parameters
For a detailed walkthrough of network setup and best practices, refer to the Networks section.
Simulate

Once all required inputs are defined and successfully validated by FlowlineProSS,
the orange Simulate indicator turns green, and the Simulate now-button is enabled, signaling that the simulation is ready to begin.
Simulation Types
FlowlineProSS supports three types of simulations:
-
Fixed inputs
Simulates a single operational condition using the boundary values defined in the network setup. -
Turn-down curve simulation
Runs multiple simulations at varying mass flow rates, while keeping the outlet pressure constant (at the pressure specified in the network definition). -
Slug-limit curve simulation
Explores multiple operational points by varying both mass flow rates and outlet pressures, helping identify slugging thresholds.
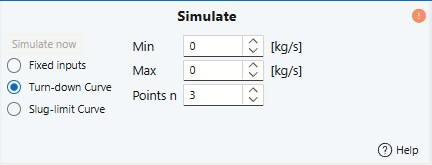
Turn-down curve.
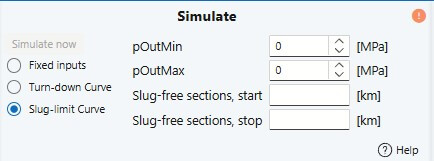
Slug-limit curve.
For the last two simulation types, users must define the range of boundary conditions to be explored.
Detailed instructions on how to configure these last two types of simulations can be found in the Simulating section.
Results

All simulation results—whether from fixed inputs, turn-down curves, or slug-limit curves—are automatically saved. You can retrieve and plot both recent and historical results together, making it easy to compare different scenarios, such as various line diameters, pressures, or flow rates.
Plotting & Exporting
- Results can be visualized through multiple plot types.
- Both the plots and the underlying data can be copied for use in reports or further analysis in spreadsheets.
- You can study results from previous simulations even while new ones are running.
For a deeper dive into result handling and visualization options, refer to the Plotting results section.