Simulating
Fixed inputs simulations
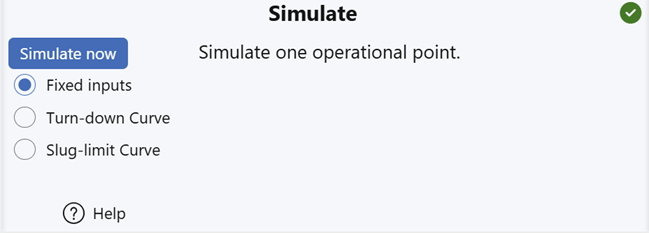
When the Simulate flag turns green, it indicates that all required data have been defined and pass basic validation checks. At this point, fixed inputs simulations can begin. If everything is configured correctly, results for the system—based on the pressures, mass flows, and temperatures defined in the Network section—will be calculated within seconds.
For networks containing multiple lines, fixed inputs is the only available simulation mode. Advanced options like turn-down and slug-limit simulations are reserved for single-line configurations.
Before starting, the status panel displays an idle progress bar, indicating that simulation is ready to begin. If previous results exist, plotting can proceed in parallel.

Shortly after launching the simulation, progress feedback appears (e.g., 30%) and updates continuously until completion.

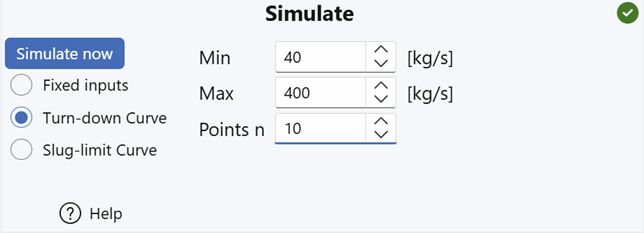
A turn-down curve simulates system behavior across a range of mass flow rates, while keeping the outlet pressure fixed (as specified at Boundary 1 in the Networks section).
Although turn-down simulations are available only for single-line configurations, multi-line networks can often be simplified to a primary line—making this analysis accessible in many cases.
The simulation process is fully automated. Users simply specify:
- A minimum and maximum mass flow, and
- The number of evenly spaced flow points to simulate between those limits.
The status panel provides real-time feedback as each point is computed:
Slug-limit curve simulations
Slug-limit curves represent a powerful new method for analyzing flow conditions in pipelines. Currently, FlowlineProSS is the only simulator that supports this feature, so it may be unfamiliar to many engineers.
What are slug-limit curves?
While somewhat similar in appearance to turn-down curves, slug-limit curves serve a different purpose:
- Turn-down curves aim to determine whether significant slugging occurs, but
- Slug-limit curves allow users to specify where to completely avoid slugs.
- Outlet section: Slugs exiting the pipeline can flood inlet separators, potentially causing shutdowns.
- Inlet section: Severe slugging here can generate pressure pulsations that travel back into the well, leading to issues like increased sand production.
- Sharp bends: Continuous slugging near bends can create reaction forces, resulting in vibrations and fatigue damage.
Slug-limit curves help engineers design systems and define operating conditions that minimize slugging in critical sections of the flowline.
Using the simulator
As with all input controls in FlowlineProSS:
- The slug-limit curve input form includes tooltip guidance.
- Simply hover your cursor over each field to view explanatory text.
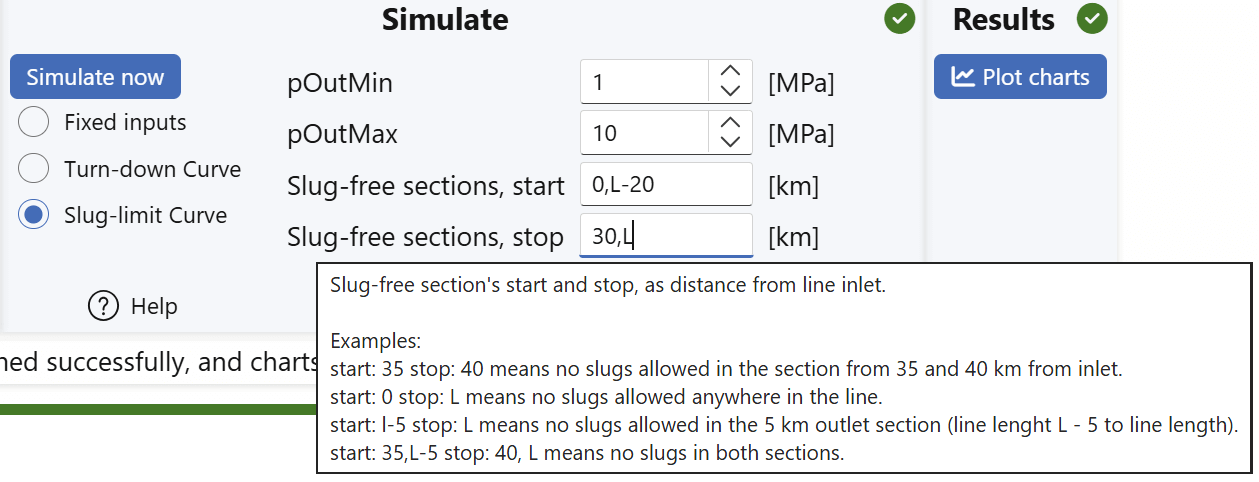
In the example above, two slug-free sections have been defined—primarily to demonstrate how to specify them. In practice, it's far more common to specify only the slug-free area at the outlet.
Understanding the example
-
First slug-free section:
Begins at 0 km from the inlet, which is the start of the pipeline. It should not necessarily extend more than 30 km into the line. -
Second slug-free section:
Begins at L - 20 km from the inlet, whereLrepresents the total length of the line (i.e., the outlet end).
This section extends all the way to the outlet at L. -
The results indicate the pressure and flow boundaries that satisfy all specified criteria. Depending on the elevation profile, these conditions will typically result in slug-free flow even beyond the explicitly defined sections.
Slug Propagation Considerations
Once slugs form, they may propagate into slug-free zones. To mitigate this, it's recommended to specify a long slug-free distance upstream of the outlet—for example:
- "20,000 × ID" (where
IDis the internal diameter of the pipe).
This helps ensure slugs are dissipated before reaching the specified areas.
Mathematical Properties of Slug-Limit Curves
Slug-limit curves differ from turn-down curves in two key ways:
- They offer one additional degree of freedom because
- The outlet pressure is not treated as constant.
Therefore, users must specify:
- Minimum outlet pressure
- Maximum outlet pressure
These bounds establish the range of interest for the simulation. They correspond to the outlet pressures the system may be designed to operate within—potentially regulated using a choke or-now or in the future-an outlet compressor.
Setting these limits ensures that the slug-limit curve analysis reflects realistic operating conditions and helps guide system design decisions.
Plotting Results
As explained in the Plotting results and Slug-limit curves chapters:
- Slug-limit curves show the required outlet and inlet pressures as a function of mass flow through the flowline.
- The flow regimes along the line for each point on the slug-limit curve can also be plotted.
- This helps determine whether the specified slug-free conditions can be maintained under varying flow rates.