Elevation Profile
General

Clicking the Open line editor button opens the line editor. It allows you to define everything of relevance to the line itself:
Its inner and outer diameters, the layers it consists of (strength and thermo-insulating properties), its inner surface roughness, and its surroundings.

Getting started
Creating a line from scratch in FlowlineProSS typically involves the following steps:
-
Prepare the grid: Add or remove layers so the grid matches the number of layers your line requires. Most lines use either:
- 1 layer (e.g., pure steel), or
- 2 layers (e.g., steel and thermal insulation).
-
Fill in the first row: Populate all cells in row 1. You can insert typical material data values automatically by right-clicking the cells (details below).
-
Input survey data: The first two columns — distance from inlet (
x) and elevation (z) — often available from surveys. Paste these values as two tab-separated columns using thePaste CSV Databutton.

- Copy values from the ones above: If all values inserted at row 1 (except
xandz) are the same through the whole line, they can be copied to every column by clicking theAuto fill missing valuesbutton:

- Save the result: The table is finished, and you may click the
Savebutton and continue defining the network:

- Once you've completed point 3, click the
Export CSVorExport XLSX Filebutton to download the table. - Edit the file using your preferred spreadsheet application.
- After editing, save the file as a tab-separated
.txtfile. - Upload the file using the
Choose Filebutton and proceed to point 5.
The table columns
Here is a description of each column in the elevation profile table:
| Parameter | Relevance | Comment |
|---|---|---|
| x | Distance from inlet. Measured along the line, meaning neighboring x-points must be no nearer than neighboring z-points. | Must always be filled in for every point. Consider inserting together with z using the Paste CSV-button. |
| z | Elevation, usually referred to sea level, so that subsea uses negative values. | Usually filled in for every point. Consider inserting together with x using the Paste CSV-button. |
| d | Inner diameter. | Measured at no pressure. FlowlineProSS increases it slightly due to elasticity when pressurized. |
| ks | Equivalent absolute sand roughness. | As defined by Nikuradse, and used in the Moody Diagram. Right-click a cell in this column to get suggestions, or read more details further below on this page. |
| Us | Uniformity factor. | Use value 1 for multiphase flow, 10 for single-phase flow. This is explained in Ref. [2], Chapter 2. |
| d1,2,.. | Outer diameter for layer 1 (innermost), 2.. and so on. | Relevant to thermal resistance, and – for the "strong" layer – line wall elasticity. |
| kf1,2,... | Thermal conductivity for layer 1 (innermost), 2.. and so on. | Relevant to thermal resistance. Right-click a cell in this column to get suggestions, or read more details further below on this page. |
| index | The index for the "strong" pipe layer, which takes up the forces caused by inner overpressure. | Example: For a line with layer 1 being inner coating, layer 2 being steel, and layer 3 being weight concrete, the index is 2. |
| EStrong | E-modulus for the "strong" layer. | Right-click a cell in this column to get suggestions, or read more details further below on this page. |
| T_Ambient | Ambient temperature. | Relevant to heat loss calculation. |
| z_Buried | How far the lower side of the pipeline's outermost layer is below the ground. | z_Buried ≤ 0 means not buried, z_Buried ≥ outer diameter ⇒ Fully buried, else partly buried. |
| kfs | The soil's thermal conductivity. | Must be filled in, but is only used for fully or partly buried lines. Right-click a cell in this column to get suggestions, or read more details further below on this page. |
| fluid | Fluid type surrounding the unburied part of the line. | 1 means air, 2 means water. |
| vAmb | Outside fluid velocity, component perpendicular to the line. | Wind or current. Must be filled in, but only used for unburied and partly buried lines. |
Buttons
Here is a description of the buttons in this elevation profile editor:
| Button | Function | Comment |
|---|---|---|
| Insert row above selected | Insert a blank row above the one ticked in the first column. | |
| Insert row below selected | Insert a blank row below the one ticked in the first column. | |
| Delete selected rows | Delete all rows ticked in the first column. | |
| Clear | Delete all rows. | |
| Add layer | Add a pipe layer outside the existing layer(s). | |
| Remove layer | Remove the outermost pipe layer. | |
| Save | Save this line with all its data. | The text above the button indicates if the table is OK. |
| Export CSV | Download the table to the local computer. | Downloads with columns tab-separated as a .txt file. |
| Export XLSX | Download the table to the local computer. | Downloads as a Microsoft Excel .xlsx file. |
| Copy CSV to clipboard | Copy to your local computer's clipboard. | Can be pasted into a document, producing tab-separated columns. |
| Paste CSV data | If tab-separated CSV-format of x and z already has been copied into the clipboard, it can be pasted directly into the table. | This is a common way to define the elevation profile: just paste in x and z, as they were found in the survey. |
| Select file to upload | Upload a file from your local computer into the table. | The table must contain tab-separated columns, be in .txt-format, and have the same number of columns as the table (adjust number of layers if necessary), see additional description further down. |
| Open | Remove Points Intelligently | Remove unnecessary points to make the table more compact. | Relevant if the survey has produced many more elevation points than necessary. |
| Open | Add Irregularity | Adding points to increase the irregularity is relevant for uneven pipeline route which has not been well surveyed. | This tool can help produce more realistic friction and volume fractions for poorly surveyed pipeline route, see additional description further down. |
Getting help along the way
Four columns require material properties related to friction, pipe-wall elasticity, and heat conduction: Right-click an empty cell to get typical value suggestions for the most common materials.
Inner surface absolute roughness
The inner surface is in contact with the fluid and affects friction. One key parameter for calculating that is absolute roughness. Right-click an empty cell in the Abs. surface roughness column to see suggested values:
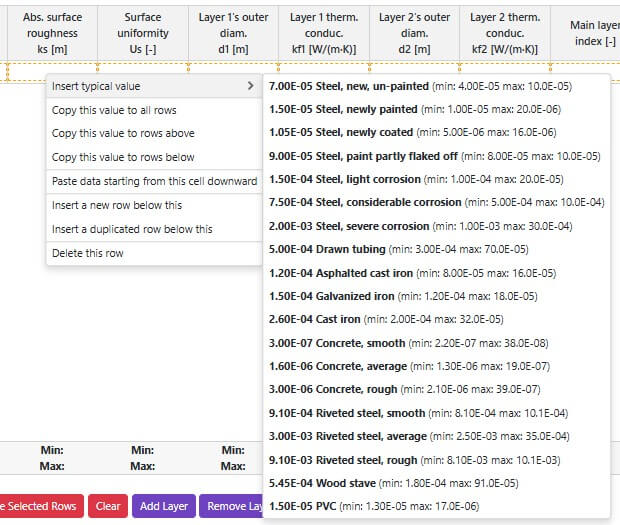
Roughness can change over time (e.g., corrosion or damage), and exact values are often unknown.
For multiphase flow, overall pressure loss is usually driven more by other effects than by roughness alone.
Structural layer E-modulus
The structural layer takes up hoop stress from internal overpressure, causing slight radial expansion. This increases the effective diameter and can raise capacity slightly (perhaps 1% for large gas export lines).
For multiphase flow, highly accurate E-values are usually not essential. In single-phase liquid systems, however, accurate elasticity is critical for pressure-surge analysis (e.g., rapid valve closures or pump events for transient analysis).
Right-click a cell (not the heading) in Main layer EModulus EStrong to see suggestions:
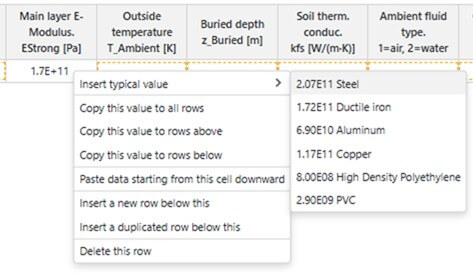
Tell FlowlineProSS which layer is structural by setting Main layer index.
This is most often 1 (if no inner coating) or 2 (if an inner coating constitutes layer 1).
Pipe material thermal conductivity
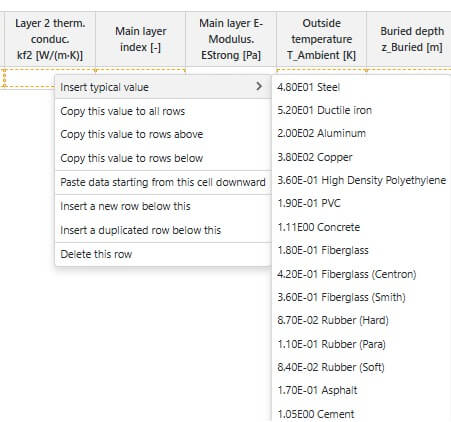
Pipe thermal conductivity affects heat loss. Insulation is often added around the line to reduce heat transfer. Weight concrete, commonly used to enhance on-bottom stability, also contributes thermal resistance when present. All layers affect heat flow through the wall to at least some extent, and FlowlineProSS therefore requires thermal conductivity for each.
Right-click an empty cell in any Layer n therm. conduc kfi column to see suggestions (shown here for layer 2. Two columns exist per layer; outer diameter and thermal conductivity):
Soil thermal conductivity
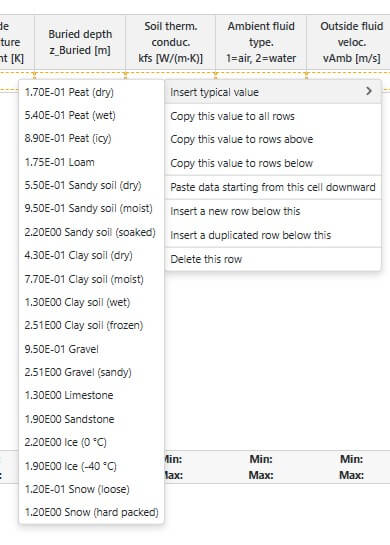
When a line is fully or partially buried, soil thermal conductivity becomes a key factor—as the surrounding soil contributes to the overall thermal insulation of the system.
The burial depth is defined as follows:
| Burial Condition | z_Buried Value Range | Description |
|---|---|---|
| Not Buried | z_Buried ≤ 0 | Pipe is fully exposed |
| Partially Buried | 0 < z_Buried < Outer diameter | Pipe is partially covered by soil |
| Fully Buried | z_Buried ≥ Outer diameter | Pipe is completely covered by soil |
To assist with input, you can right-click an empty cell in the Soil therm. conduc. kfs column to view typical conductivity values:
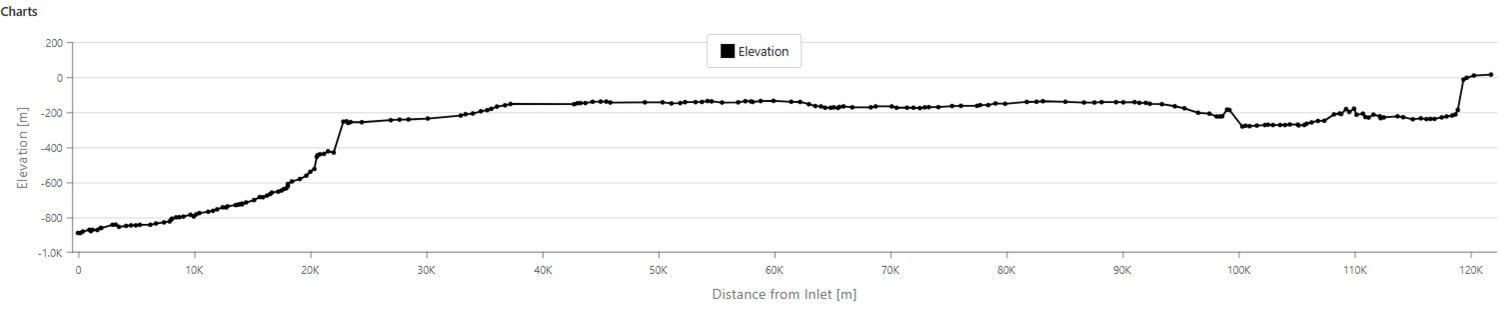
As you define the flowline, a plot is drawn at the bottom of the page. It gives useful feedback. It may look like this:
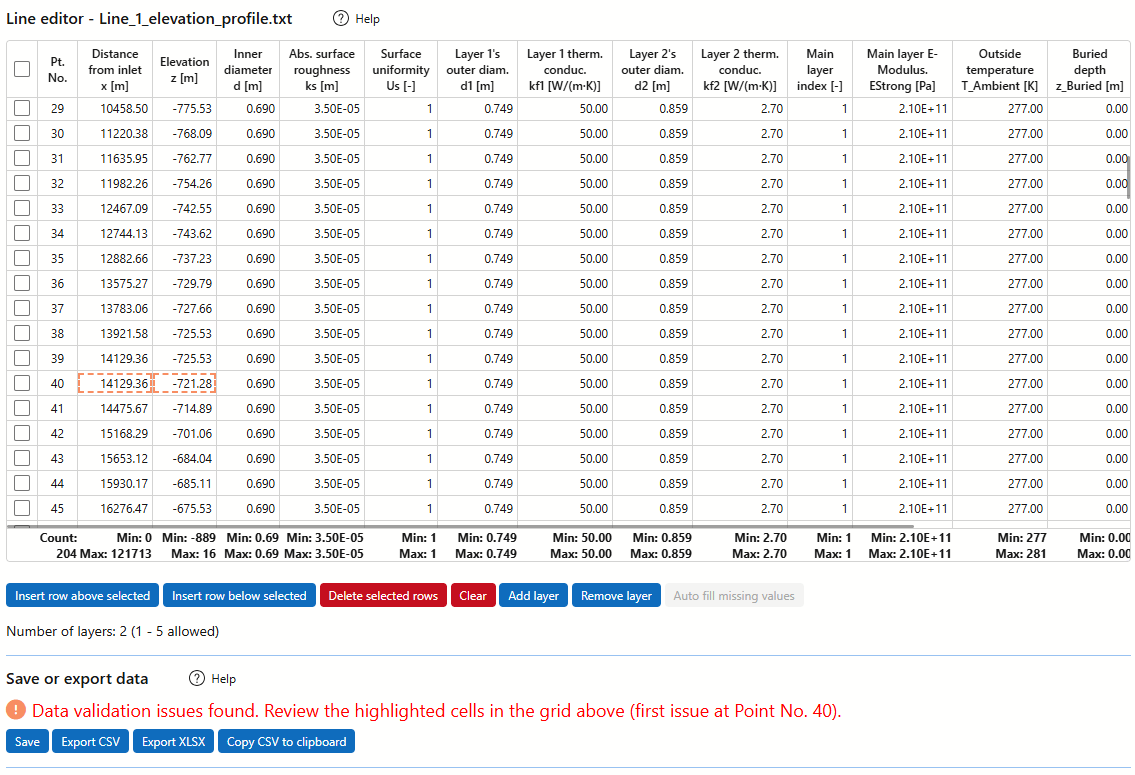
Validation & Error Checking
After saving a line, FlowlineProSS performs automatic validation. If any errors or inconsistencies are found, you’ll receive clear feedback.
For example, in the image below, two cells in row 40 are highlighted. The red status text a few lines below the table indicates a validation issue:
Reason: The x values are not strictly increasing, leading to 2 different points being located at the same position x.
Other automatic checks include:
- Ensuring that the difference between
xvalues is greater than or equal to the elevation differencezbetween the same points (remember that x is measured along the line, no matter which direction it points). - Detecting nonphysical or accidental inputs.
- The bottom row of the table displays the
minimum and maximum valuesfor each column. - These values are
not used in calculations, but serve as a helpful reference to detect outliers or input errors.
Path modifications
General
There are two common scenarios where modifying the elevation profile table becomes relevant:
- The survey used to define the line’s path is highly detailed, resulting in far more data points than necessary for simulation purposes
- A detailed survey has not yet been conducted, and the elevation profile is still being approximated
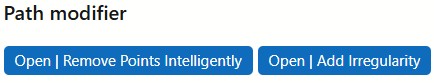
In either case, the Path modifier tool provides two key functions to streamline or construct the elevation profile.
These functions can be accessed using the buttons shown below:
Removing elevation points
Flowlines typically have limited flexibility, and for multiphase pipelines, there is rarely a need for elevation profile points spaced closer than 100 meters—even if the original survey data is much denser.
For long pipelines, and especially for single-phase systems, it can be beneficial to reduce the number of elevation points.
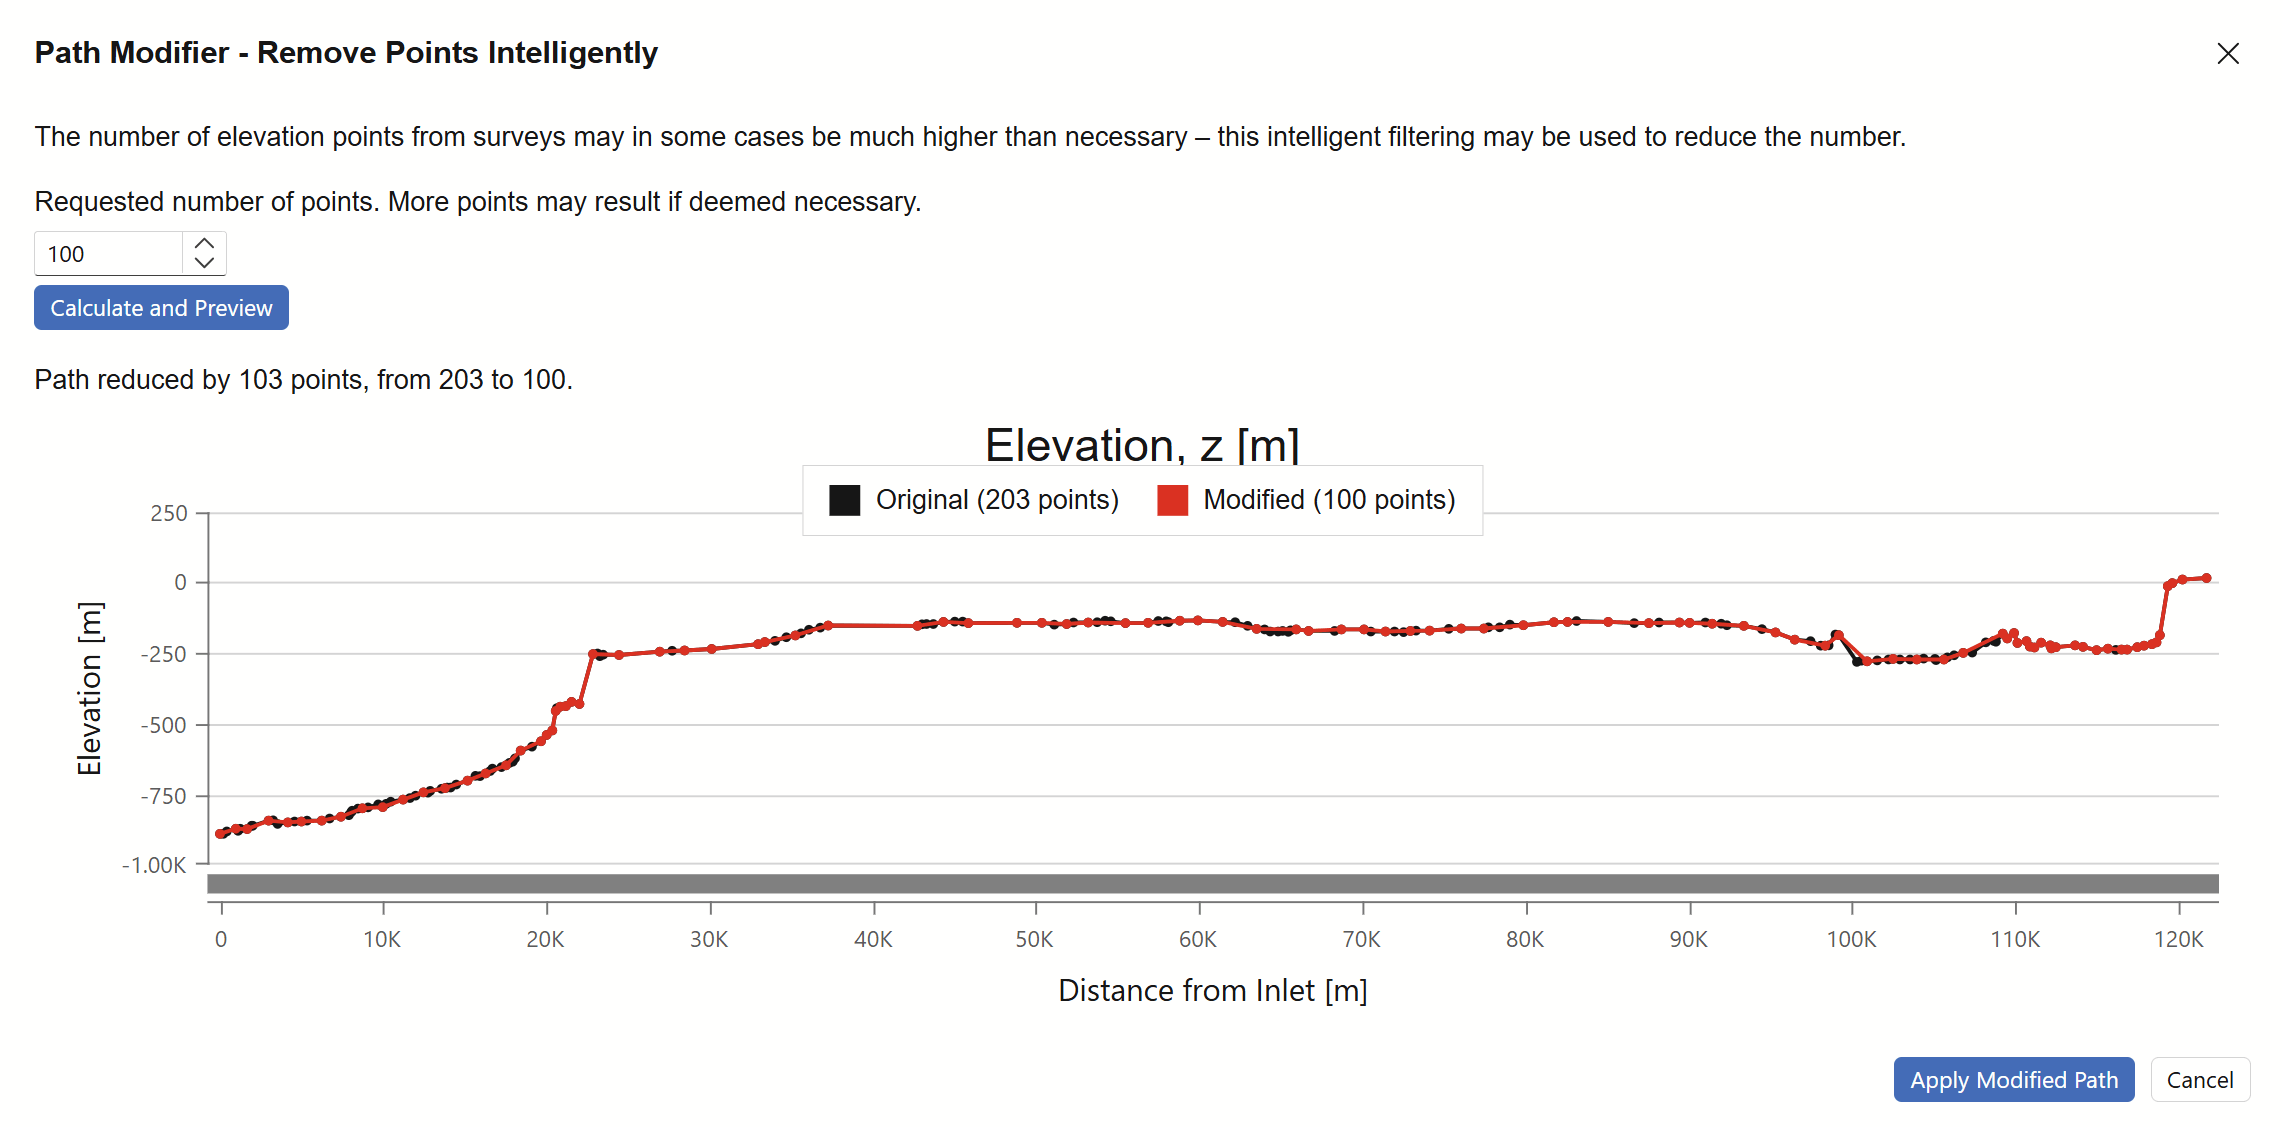
The Path Modifier – Remove Points Intelligently tool helps streamline the dataset by selectively removing points where the line’s direction remains unchanged or changes minimally. This preserves the overall shape of the profile while significantly reducing data volume.
In the demonstration shown below, the number of points is reduced from 203 to 100. In real-world applications, reductions from 10,000 to 1,000 points are not uncommon—making simulations faster and more manageable without compromising accuracy.
Adding elevation points
During early project phases—when no detailed subsea route survey is available—the elevation profile may be defined using only a few simplified points.
However, because liquid buildup and friction vary significantly with elevation angle, especially near horizontal segments, such simplifications often underestimate average friction, liquid holdup, and slugging potential.
To address this, it can be beneficial to introduce random elevation irregularities—either to produce more realistic simulation results or to assess the system’s sensitivity to potential seafloor variations.
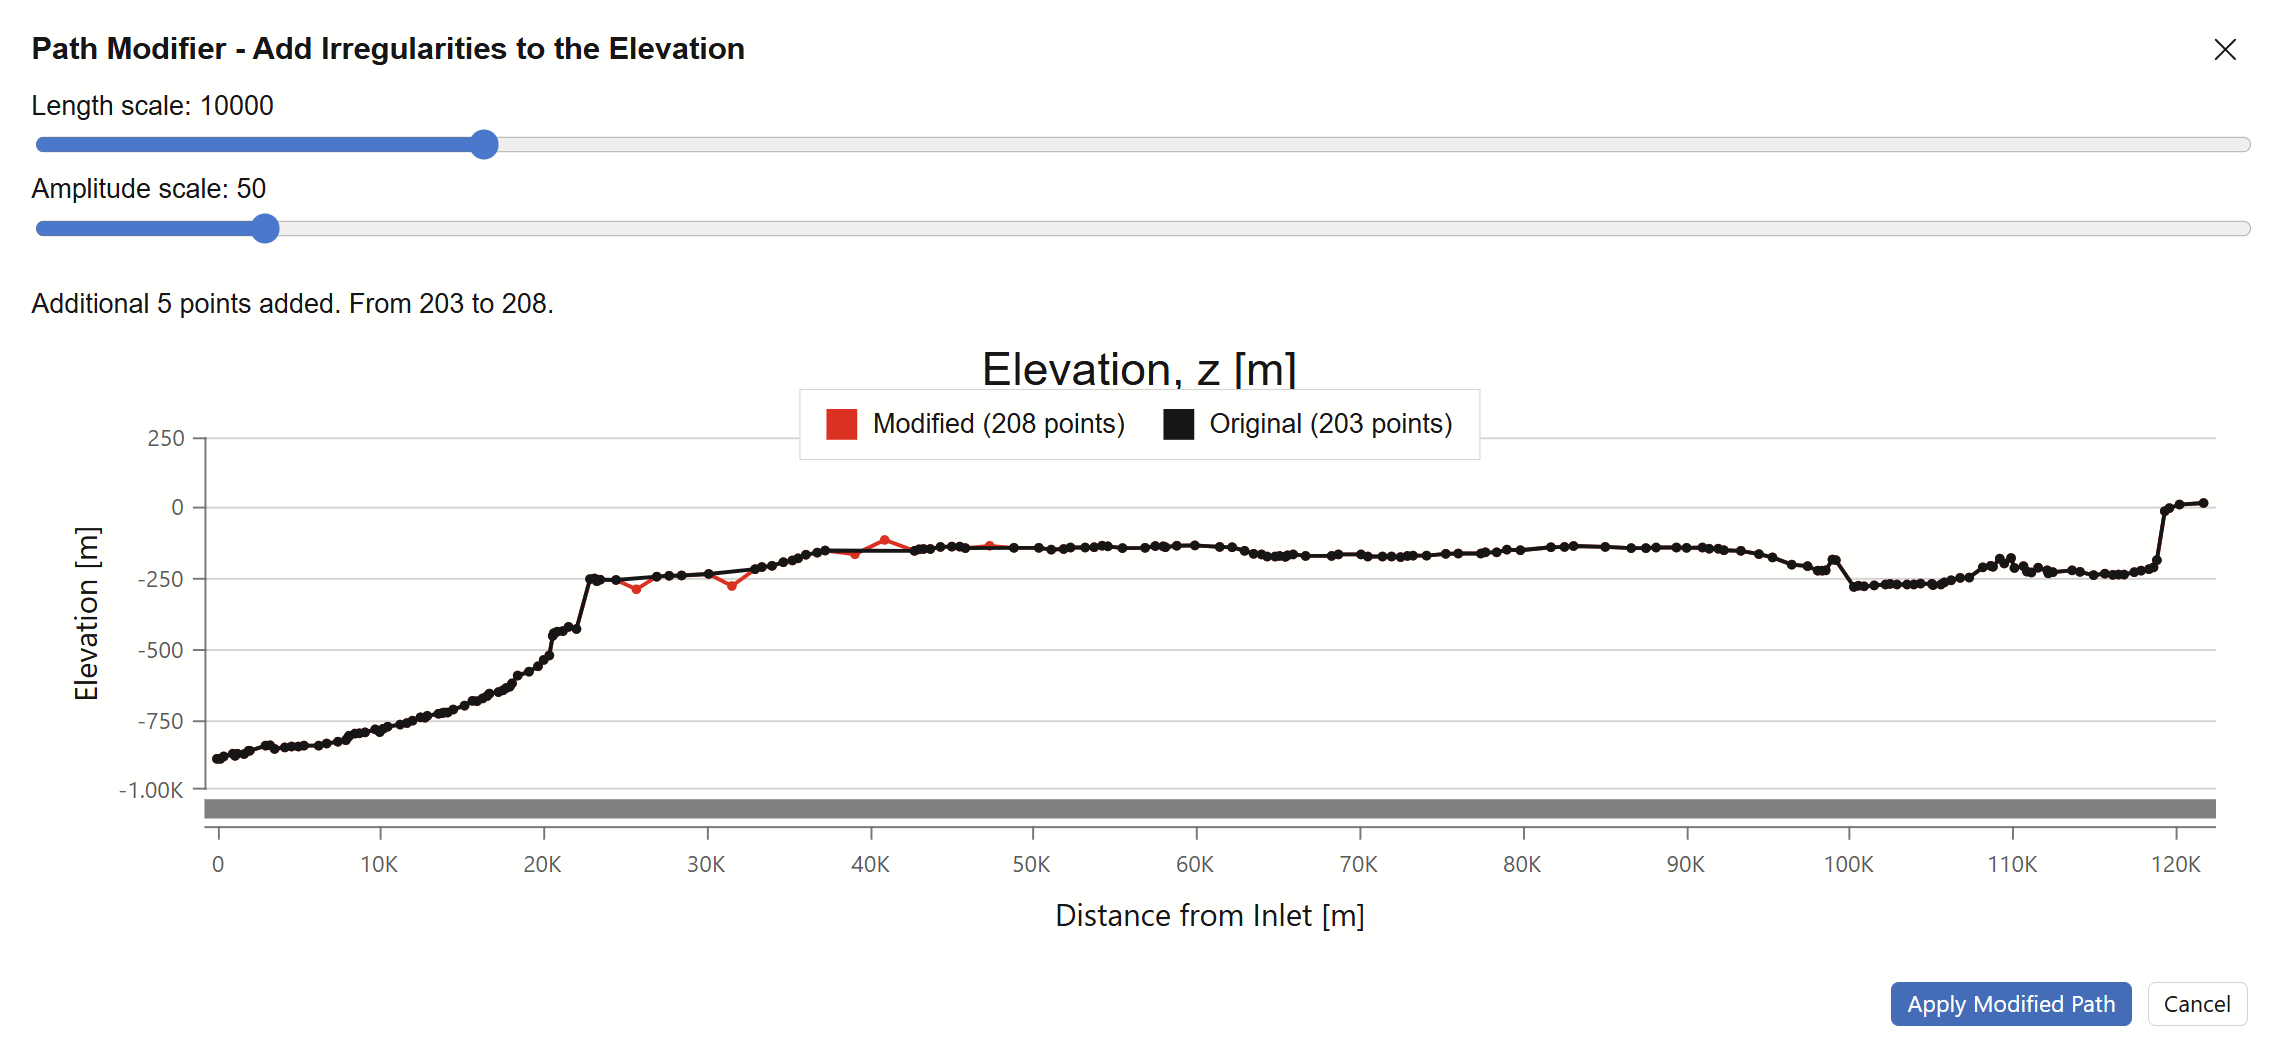
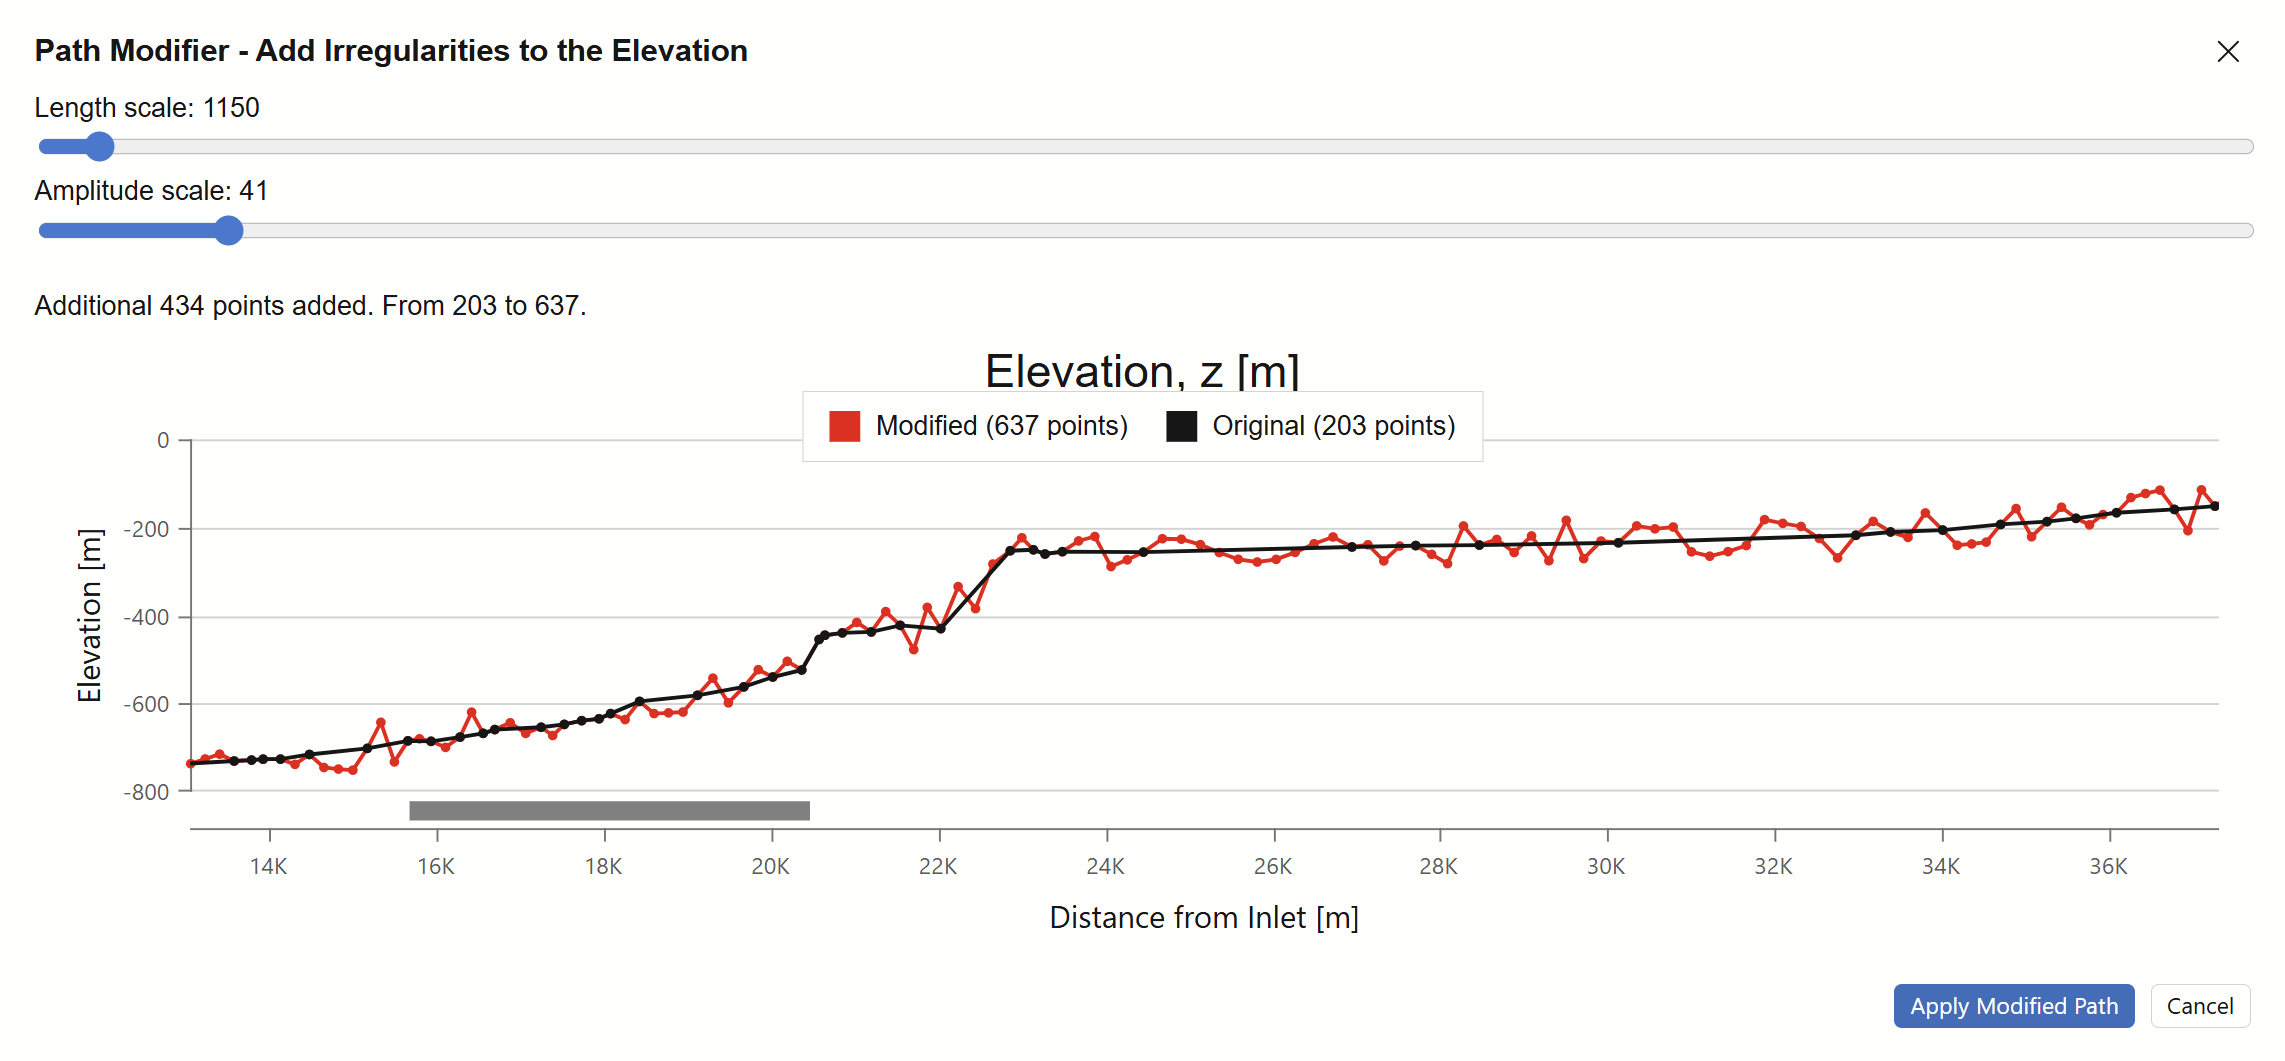
The Path Modifier – Add Irregularities to the Elevation tool allows users to define both the length scale and amplitude scale of the irregularities. The modified elevation profile is immediately visualized in the plot below, and the updated number of points is displayed.
Users can zoom in to inspect the unevenness of the modified profile in greater detail before confirming changes with the Apply Modified Path button:
After additional points are added, only the x and z columns will contain values.
A message above the Save button will indicate that some values are missing.
To resolve this, click the Auto fill missing values button—starting from the top, it will copy values from the row above into any empty cells.
Saving the Profile
Once the line has been fully defined and passes validation, click the Save button to store the elevation profile within the project.