FlowPatternAnalyzer
Introduction
The FlowPatternAnalyzer is a novel tool designed for both pedagogical and engineering purposes. It provides an early overview of which flow regimes are likely to occur under various operating conditions.
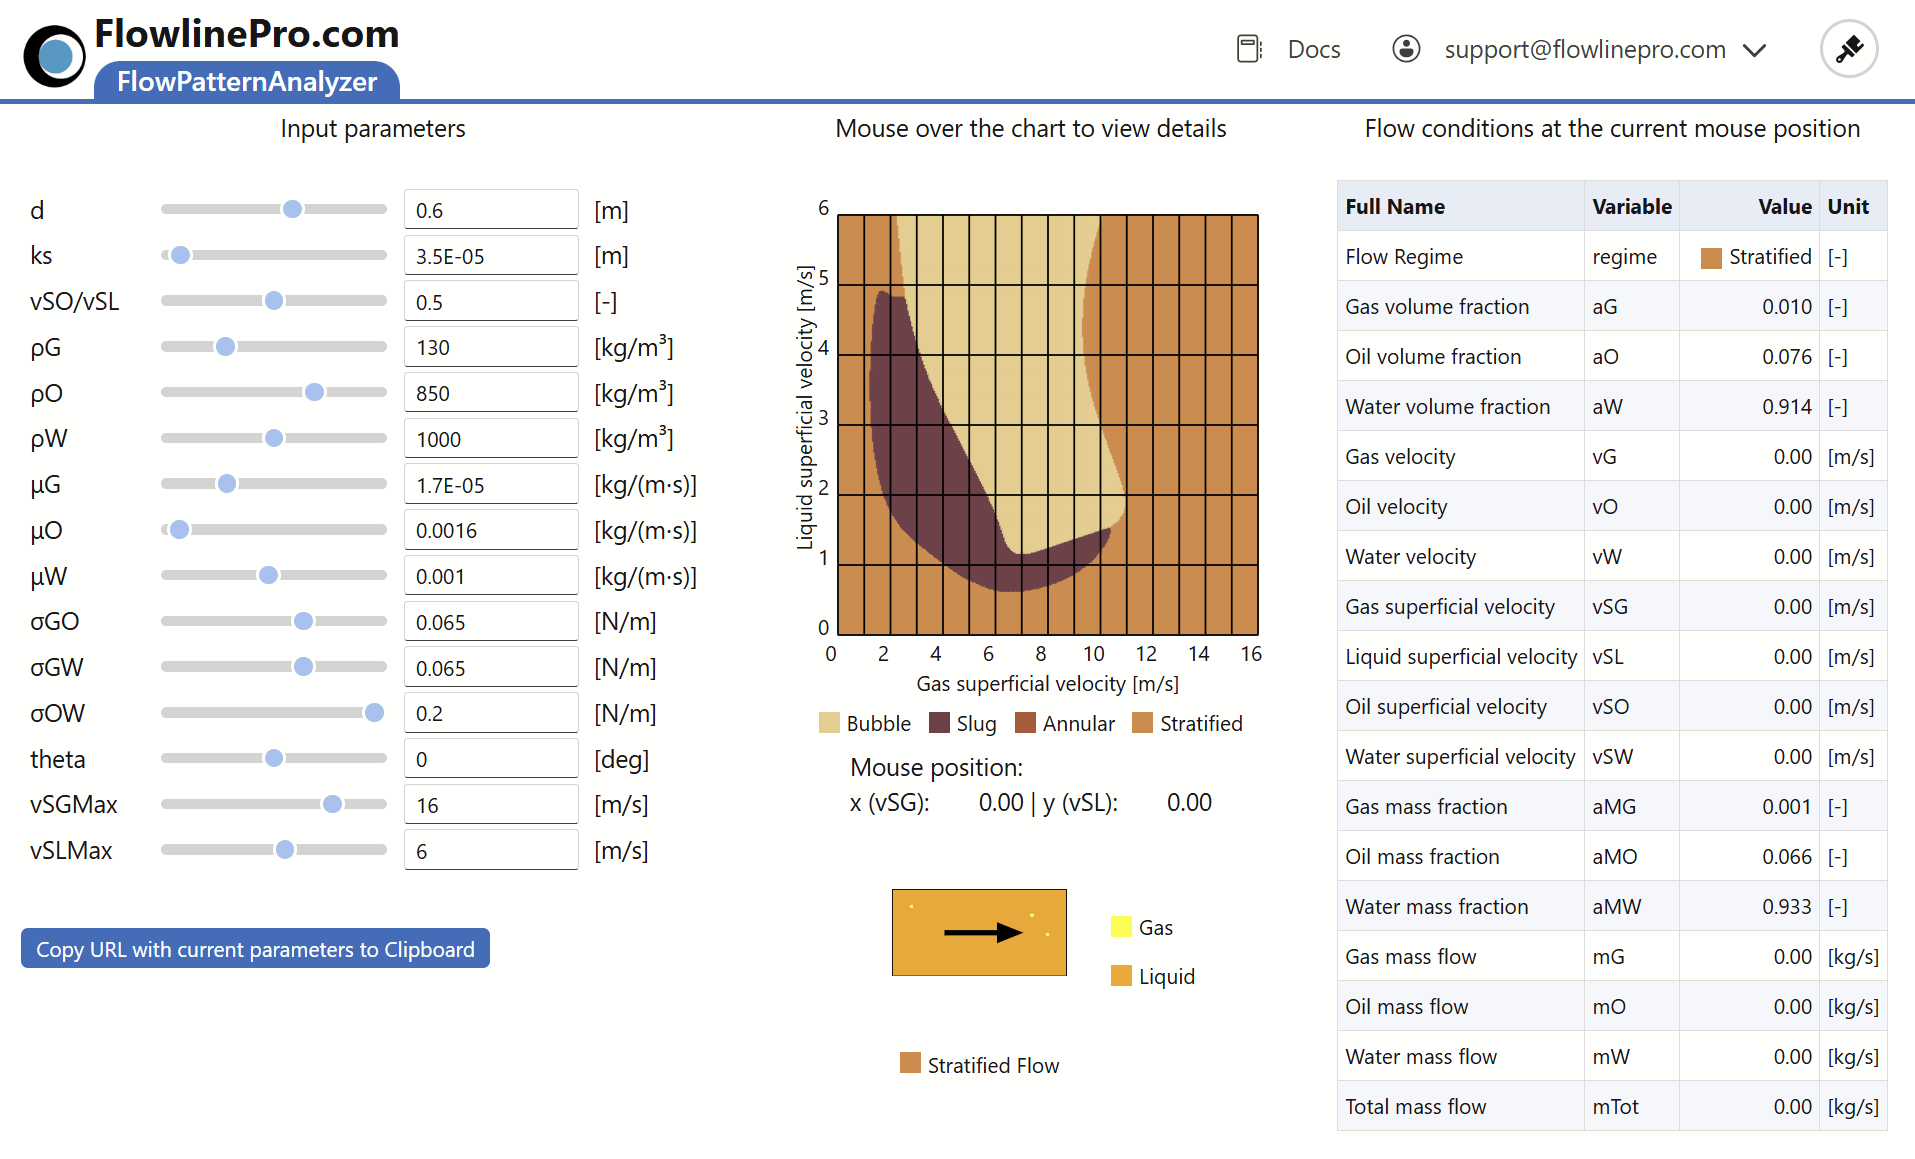
Users can move the cursor over the flow regime plot to view corresponding volume fractions, velocities, and other parameters. Input parameters are adjusted using the blue track-bars to the left of the diagram, while results at the cursor’s position are displayed on the right.
The flow pattern diagram uses superficial gas velocity vGS [m/s] on the horizontal axis, and
superficial liquid velocity vSL [m/s] (oil and water; vSL = vSO + vSW) on the vertical axis.
Before exploring the diagram, it’s recommended to adjust the default input values to approximately match expected
conditions in the flowlines of interest.
These parameters include pipe inner diameter d, elevation angle θ, and fluid properties such as densities and viscosities for each phase.
A small icon at the bottom of the diagram visually indicates the flow regime at the selected point.
A YouTube video of an early, two-phase version demonstrates the basics: Illustration of FlowPatternAnalyzer
Elevation Angle Sensitivity
The dark brown area in the flow regime diagram corresponds to conditions that lead to slugging. As you will see, the advanced 3-phase calculations used to generate this plot often produce flow regimes that differ significantly from those predicted by more simplistic models.
The screenshot below is similar to the one above, except the elevation angle has been changed from 0° to 1° upward.
The cursor was positioned at vSG = 5, vSL = 4.
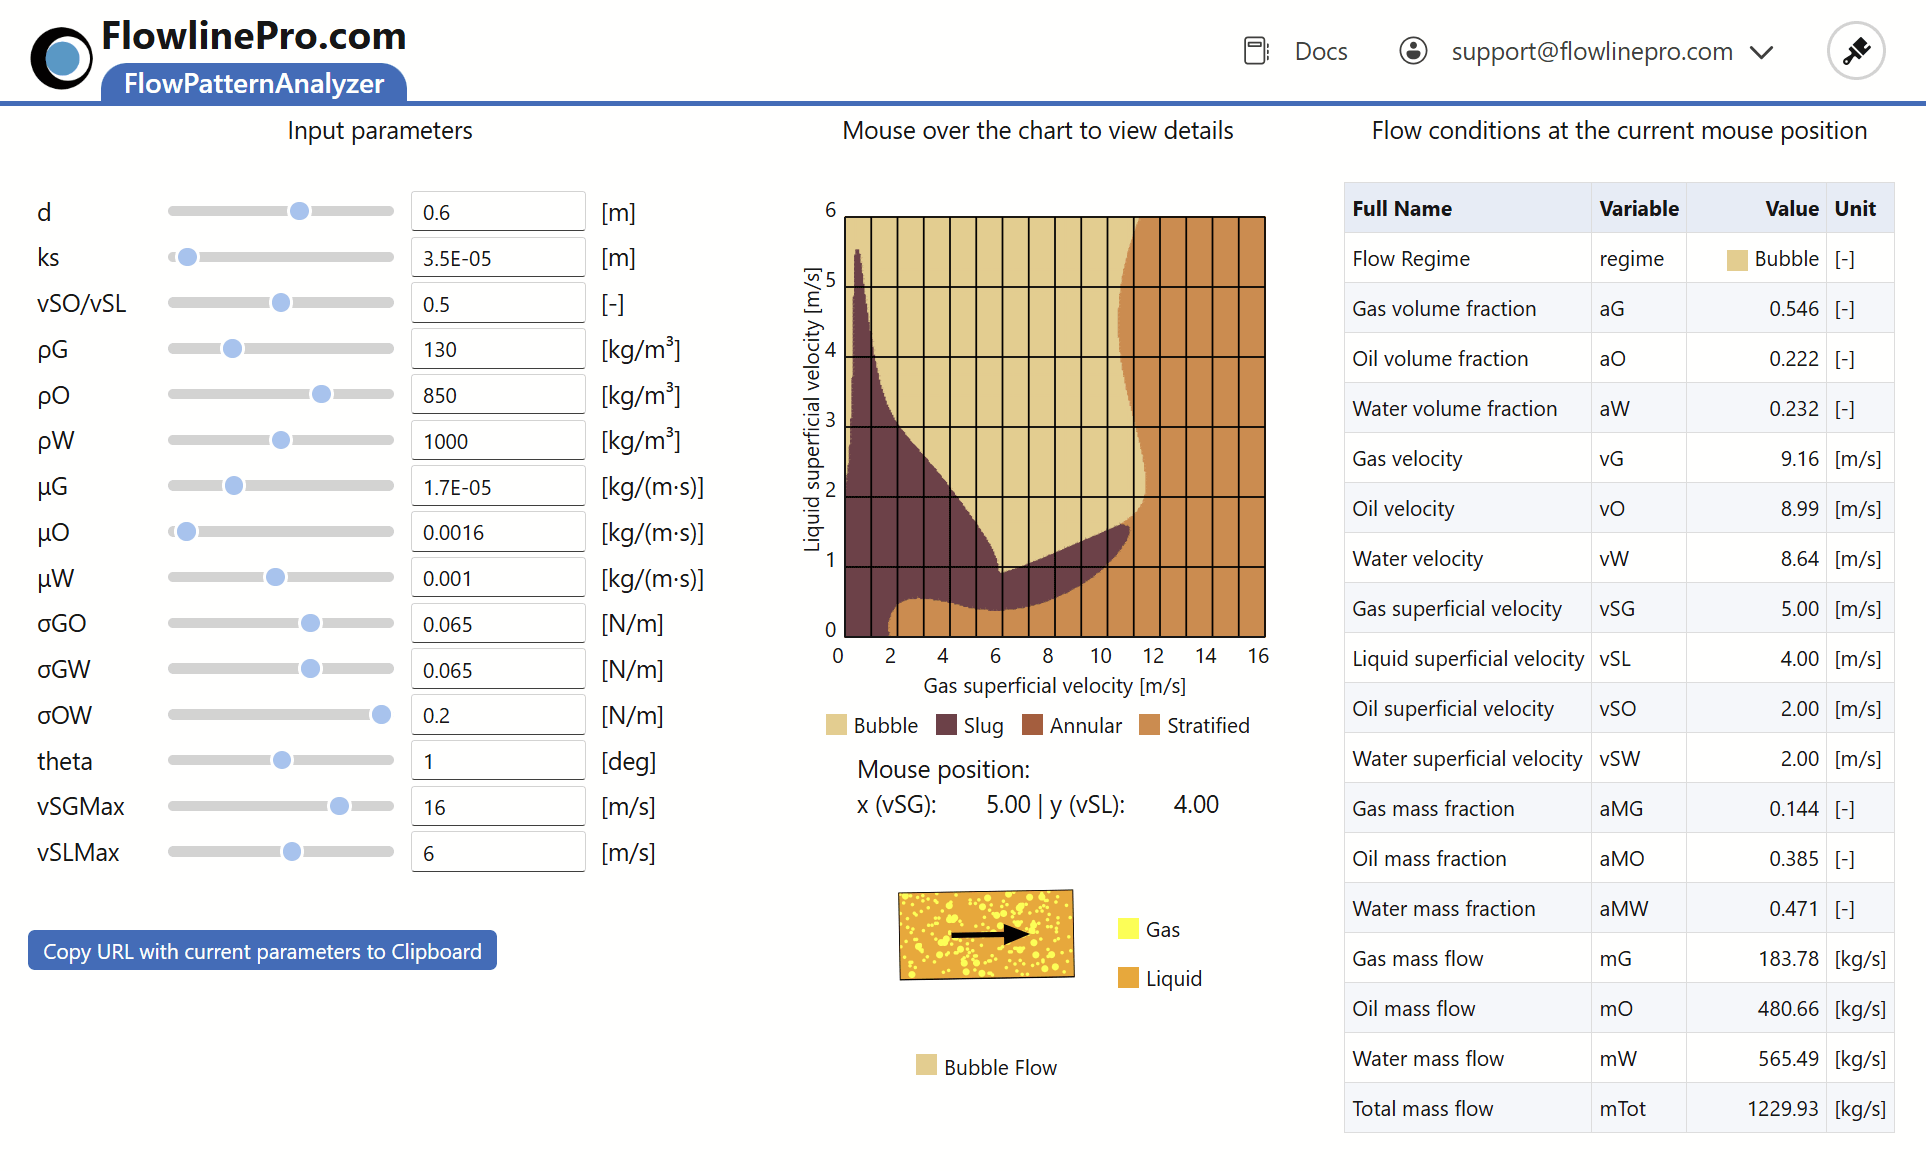
As shown, this small change in elevation dramatically expands the slugging region.
To avoid slugging at any liquid superficial velocity, the gas superficial velocity would need to be around 11 m/s.
However, if the liquid superficial velocity is kept below approximately 0.5 m/s, the flow regime remains stratified down to vSG = 2 m/s.
Note that other parameters—such as gas volumetric fraction—have not changed significantly.
This is because the selected point (vSG = 5, vSL = 4) corresponds to slugging in both cases.
If a point corresponding to stratified flow or a different regime were selected, the results would differ more noticeably.
Avoiding Slugging
As demonstrated in the example above, slugging is least likely under the following conditions:
- High gas superficial velocities
- Low liquid superficial velocities
- Horizontal or downward-sloping elevation angles
Interestingly, while vertical upward flow is typically more prone to slugging than near-horizontal flow, it is not always the worst case. In fact, moderately steep upward angles can be even more problematic. The plot below shows flow regimes for vertical flow, with all other parameters unchanged.
Velocity Effects
Increasing velocity generally helps reduce slugging.
This is because the gas must move fast enough to entrain the liquid, preventing it from accumulating in upward-sloping sections of the line.
However, excessive velocity introduces new challenges:
- High friction losses, which may reduce production efficiency
- Erosion risks, especially in bends or restrictions
- Increased sand production in wells due to more turbulent flow
Selecting appropriate line diameters—and the resulting velocities—requires a careful compromise between these competing considerations.
Common Strategies
While other input parameters can influence slugging behavior, they are often less impactful—and typically harder to modify.
Practical strategies for increasing flow velocity to mitigate slugging include:
- Reducing line diameter to boost gas and liquid velocities at a given flow rate—while carefully managing friction losses and erosion risk
- Adjusting choke settings or installing outlet compressors to lower outlet pressure. Although this may reduce gas density (potentially increasing slugging risk), the resulting velocity gain usually outweighs the downside
- Deploying subsea compressors to enhance available flow and maintain momentum
- Adding a secondary flowline to enable gas recirculation
- Optimizing seabed routing to minimize adverse elevation changes—especially near the outlet, where liquid accumulation is most likely
The focus here is on hydrodynamic slugging, but terrain-generated slugs can also occur. As explained in the Flow Assurance Challenges chapter, shutdowns and extended periods of low flow can lead to terrain-generated slugs. In both cases, liquid accumulates in low sections of the pipeline due to insufficient gas velocity. Once flow resumes, this trapped liquid may be pushed forward as long slugs.
Why So Different?
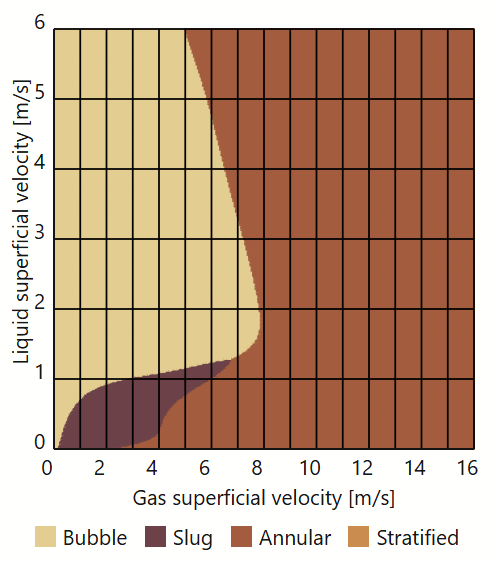
You may have noticed that the flow patterns shown in the diagram differ significantly from those commonly found in textbooks and published articles.
This distinction arises from the unique dimensional analysis that underpins FlowlineProSS’s flow patterns and friction models—an approach also used in FlowPatternAnalyzer, as detailed in Ref. [3]. The theory demonstrates that certain dimensional groups must yield identical flow patterns, even when underlying variables such as velocities, viscosities and various others, differ.
When this theory is applied to many of the widely circulated flow regime diagrams, it becomes clear that several of them do not hold up to scrutiny. By adhering strictly to these fundamental physical laws, FlowlineProSS produces flow regimes that are markedly different—and more consistent with the governing principles of fluid dynamics.
Keeping Default Values
Once representative values for your flowline have been chosen, they can be saved for later by simply copying the URL—all values are embedded. There is a button in the lower left corner for easy URL copying. Just paste the URL back into your browser anytime to restore the setup.