Verifying Results
General
Simulating multiphase flow involves a range of interconnected challenges. Beyond ensuring result accuracy and optimizing system design, engineers must also develop practical operational procedures—for normal operation, startup sequences, and mitigation of potential upsets.
These challenges span fluid characterization, flow regime prediction, thermal modeling and more, all of which must be addressed to ensure reliable and safe system performance.
- Reliable input data
- Proper configuration and manipulation of that data
- Robust, validated simulation software
- Critical assessment of simulation outcomes
Reliable input data
The quality of fluid data depends on available fluid samples when generating PVT tables. Key considerations include:
- Detailed fluid composition
- Viscosity measurements and other laboratory data is an advantage
- Anticipated changes over a field’s lifetime, such as future fluid composition, flow rates, and reservoir pressures
Also, the lines' elevation profile is critical in multiphase flow simulations. While inlet and outlet elevations are often known early, intermediate elevations generally require an offshore survey. Small changes around horizontal can dramatically affect liquid buildup and slugging.
Proper Configuration
Properly configuring a multiphase flow simulation begins with accurate data entry and automated validation. FlowlineProSS cross-checks inputs in real time, issuing errors or warnings when values fall outside predefined thresholds.
Despite these safeguards, the software cannot determine which parameters require systematic exploration to capture operational uncertainties. That responsibility lies with the engineer.
Key Configuration Questions
- What range of line diameters, wall thicknesses, and material specifications should be investigated?
- What inlet mass flow rates, pressures, and fluid compositions reflect production and reservoir changes over time?
- Which outlet backpressures, choke settings, and control-valve positions should be simulated?
- Is line heating or insulation more effective, or should chemical injection and alternative hydrate mitigation strategies be evaluated?
- Adopt a Design of Experiments (DOE) approach to build a balanced scenario matrix that ensures comprehensive parameter coverage while keeping computational effort under control.
- Use slug-limit curves to narrow the simulation space and keep the process manageable.
- Document each simulation case with operator notes to maintain traceability and streamline comparative analysis.
- Clarify optimization goals—and bring in specialized flow assurance expertise, even from outside the project team if needed.
Robust Simulation Software
Defining what constitutes “good” simulation software can be challenging for users. The developers of FlowlineProSS and FlowlineProTransient established clear design criteria from the start:
- Thorough, automatic input-data validation
- Built-in guidance for result verification
- Mechanistic models enhanced by dimensional analysis and neural networks for reliable extrapolation from lab to full scale (see Ref. [3])
FlowlineProSS applies multiple checks before and during simulation:
- Verifies that all parameters fall within physical limits
- Confirms pipeline connectivity and logical point placement
- Ensures PVT tables cover relevant pressure and temperature ranges
- Provides real-time feedback and flags suspicious data
Extensive comparisons against laboratory measurements and other simulation tools demonstrate FlowlineProSS’s accuracy. Its advanced dimensional-analysis engine is a key differentiator, enabling more reliable predictions across a wide range of conditions.
Comparing with OLGA
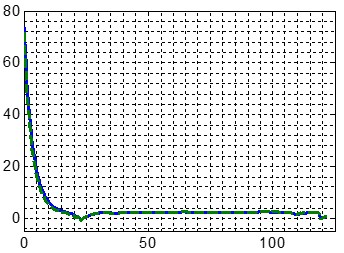
Below is a comparison between FlowlineProSS and OLGA’s steady-state module for the Ormen Lange field. Both simulations used the same Peng–Robinson compositional PVT tables, accounting for gas–liquid solubility but ignoring cross-dissolution between oil and water.
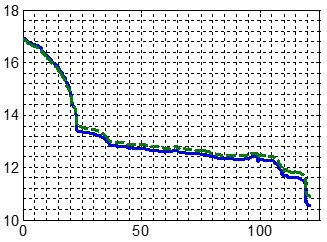
Pressure [MPa] vs. distance from inlet [km]: FP (solid) and OLGA SS (dashed).
Temperature [°C]: FP (solid) and OLGA SS (dashed).
Pressures and temperatures align closely, indicating similar friction calculations in both programs.
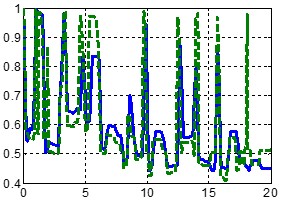
Gas volume fractions
The oil and water fractions fluctuate strongly with elevation changes. To avoid too much visual clutter, only the first 20 km are shown below—variations continue similarly along the full line. The gas volume fractions calculated by the two simulators can be seen to follow each other closely
Flow regimes
Flow regime predictions are highly sensitive to local conditions. Even moderate parameter shifts can trigger regime changes. In spite of this, the two simulation programs turn out to produce very similar flow regime results.
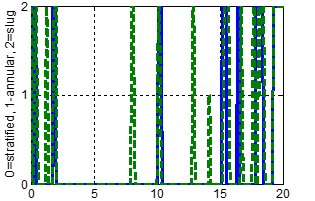
For a complete comparison between FlowlineProSS and OLGA SS, see the article referenced in Ref. [3].